Expectancy
Expectancy — The average amount you win or lose per trade, across every trade — the arithmetic mean of your results.
Expectancy answers one question precisely: what is the next trade worth, on average? It is the most useful single number in a statement and the one most often confused with a prediction.
In plain English
Take your net profit or loss for the period and divide it by the number of trades. That is expectancy. If it is +$44.72, then across this sample every trade you took was worth about forty-five dollars on average — including the losers, including the fees.
Two things make it valuable. It is additive, so expectancy multiplied by trade count reconstructs your net result exactly, which means you can reason about "what if I took 200 trades instead of 96". And it collapses win rate and payoff into one figure, which is the correct thing to do — a 30% win rate with big winners and a 70% win rate with small ones can have identical expectancy.
The version above is expectancy in currency. There is a second common form expressed in R, where each trade is measured against the amount you planned to risk. R-expectancy is more comparable across instruments and position sizes, and it requires you to have recorded your planned risk — which a broker statement never contains.
The formula
Expectancy = net P&L ÷ number of trades
- Equivalently: (win rate × average win) − (loss rate × average loss).
- Net P&L is after commission, swap and fees.
- In R terms: expectancy in R = mean of (trade result ÷ planned risk for that trade).
The two formulas above are the same arithmetic written two ways. If they disagree on your statement, something is being counted twice.
Worked example — the demo account
The demo account, 96 closed trades:
| Net P&L | +$4,293.45 | |
|---|---|---|
| Trades | 96 | |
| Expectancy | +$44.72 | 4,293.45 ÷ 96 |
| Cross-check: (51.04% × $238.63) − (48.96% × $157.44) | +$44.72 |
Every trade on this account was worth +$44.72 on average.
The second row of arithmetic is worth doing yourself once. Win rate 51.04% × average win $238.63 gives $121.80 of expected gain. Loss rate 48.96% × average loss $157.44 gives $77.08 of expected loss. The difference is $44.72, the same number, arrived at from the other direction.
And now the useful part: 96 trades × $44.72 ≈ $4,293, which is the net result. If this account keeps its properties and takes another 96 trades, the central expectation is roughly another $4,300 — with a standard deviation per trade of $240.49, which is more than five times the expectancy. That ratio is what makes the outcome uncertain, and it is what SQN tries to summarise.
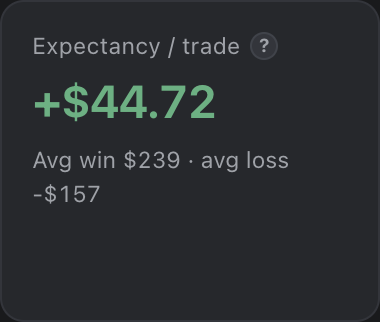
Every figure above is from the demo account TapeSheet ships with — 96 closed trades, generated from a fixed seed. Open the same account →
What this does not tell you
The caveat is the part worth reading. Most tools put it in a footer, if they print it at all.
- It is an average, not a forecast. No individual trade is worth $44.72. Roughly half of them lost money. Expectancy describes the centre of a wide distribution and says nothing about how wide it is.
- It assumes the future resembles the sample. A positive expectancy computed on a trending quarter tells you nothing about a ranging one. The market regime is not in the number.
- It ignores the path. An account with a positive expectancy can still be closed by a margin call before the expectancy arrives. Sequence risk is invisible here and shows up in drawdown.
- Currency expectancy is not comparable across position sizes. If you traded 0.1 lots for three months and then 1.0 lots, your currency expectancy describes a blend of two different systems. That is what R-multiples exist to fix.
Where TapeSheet shows it
The “Expectancy / trade” tile on the Overview, with average win and average loss printed beneath it. The Trades table also carries a per-trade R column once you have entered planned risk.
Related terms
See your own statement, analyzed
Drop an MT4 or MT5 statement on the page and the whole dashboard renders in about three seconds. No signup, no upload — the file is parsed inside your browser tab and never leaves your device.
Analyze my statementAll glossary terms ·Free trading journal ·MT4 statement analyzer ·MT5 report analyzer