Tape Score
Tape Score — TapeSheet’s own 0–100 composite of six weighted sub-scores, one of which is how many trades it had to work with — published in full, because a secret score is worthless.
Every journal product has a proprietary score and none of them will tell you how it is calculated. Ours is on this page — all six inputs, all six weights, every cap — because criticising other people’s black boxes while running one would be indefensible. One of those six inputs is the number of trades the score had to work with, which is the part no competitor does, and the reason a nine-trade account cannot score 95 here.
In plain English
The Tape Score compresses six measurements of a trading record into a single number between 0 and 100. Each input is rescaled to its own 0–100 sub-score using a fixed, published cap, and the six are then combined with fixed weights.
It exists because a dashboard of twenty numbers has no entry point, and because comparing two statements is otherwise a spreadsheet exercise. It does not exist to grade you, and it is not calibrated against any population of traders — there is no benchmark, no percentile, and no claim that 70 is “good”.
Five of the six inputs measure the trading. The sixth measures the evidence: how many closed trades produced the other five. A record of nine trades can show a profit factor of 4 and a perfect win rate, and none of it means anything yet, so a score built only from the first five would hand that account a number in the nineties. Ours discounts it for what it is — and below thirty closed trades it does not print the total at all.
It is ours and nobody else’s. It is not comparable to any other product’s score, it is not an industry standard, and a high one is not a prediction. What it says is narrow and literal: the history in this file has the properties listed below, weighted as shown.
The formula
Tape Score = Σ (sub-score × weight), rounded
- Profit factor — 20%. PF 1.0 scores 0, PF 3.0 or better scores 100, linear between. The core measure of whether there is an edge at all.
- Average win / average loss — 15%. 0.5 scores 0, 2.5 or better scores 100. The shape of the edge.
- Return ÷ maximum drawdown — 20%. 0 scores 0, 5 or better scores 100. Also called the recovery factor: profit measured against the worst decline it took to earn. This is the only place drawdown enters the score, and it enters as a ratio rather than on its own.
- Win rate — 10%. 0% scores 0, 65% or better scores 100. Deliberately the smallest weight of the five trading inputs, because it is the most over-weighted vanity metric in retail trading — a 90% win rate says nothing without the losses beside it.
- Consistency — 15%. 100 − 100 × (standard deviation of daily P&L ÷ |net P&L|), floored at 0. Catches the account that made its year in one afternoon, which is also what a prop firm’s consistency rule is looking for.
- Sample confidence — 20%. 100 × ln(n) ÷ ln(200), where n is the number of closed trades, clamped to 0–100. One trade scores 0, 30 scores 64.2, 100 scores 86.9, and 200 or more scores 100. This is the sub-score no competitor has.
Every cap is a judgement call and every one is arguable. They are written down so the argument can be had — hover any sub-score row in the app and the same cap is printed there. The weights sum to exactly 1.00, and a test fails the build if they ever stop doing so.
Worked example — the demo account
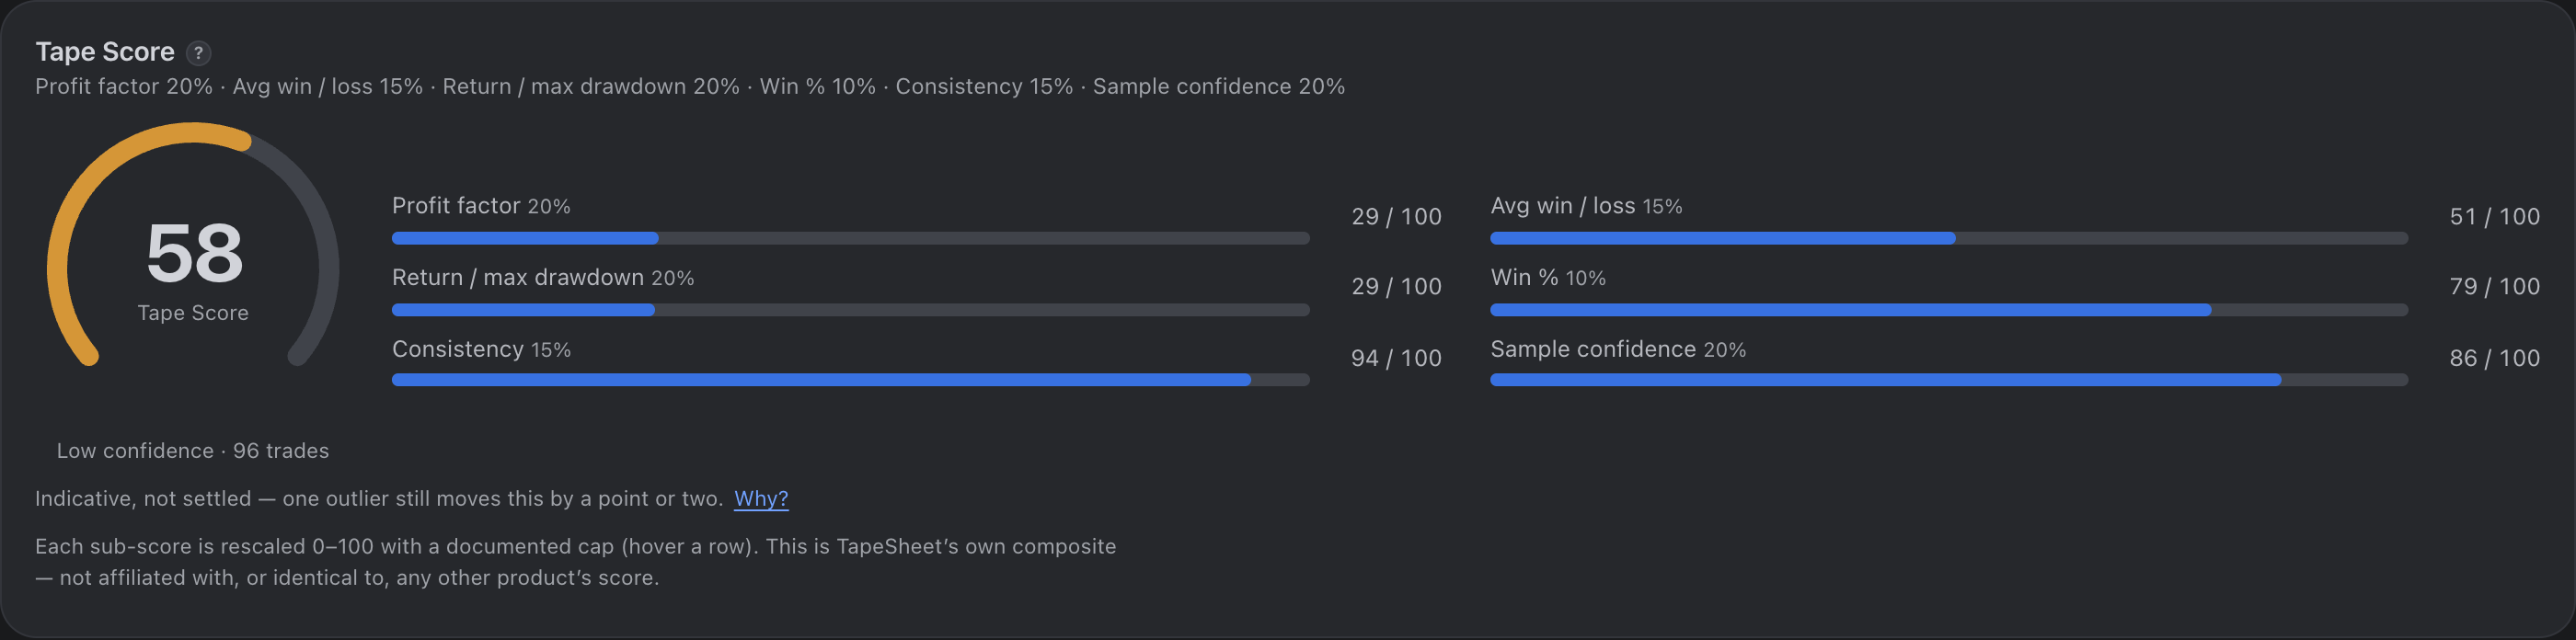
The demo account scores 58. Here is every step of it.
| Profit factor 1.5802 → (1.5802 − 1) ÷ 2 × 100 | 29.01 | × 0.20 = 5.80 |
|---|---|---|
| Payoff 1.5157 → (1.5157 − 0.5) ÷ 2 × 100 | 50.79 | × 0.15 = 7.62 |
| Return ÷ drawdown 1.4285 → 1.4285 ÷ 5 × 100 | 28.57 | × 0.20 = 5.71 |
| Win rate 51.04% → 51.04 ÷ 65 × 100 | 78.53 | × 0.10 = 7.85 |
| Consistency → 100 − 100 × (278.76 ÷ 4,293.45) | 93.51 | × 0.15 = 14.03 |
| Sample confidence 96 trades → 100 × ln(96) ÷ ln(200) | 86.15 | × 0.20 = 17.23 |
| Total | 58.24 → 58 |
A Tape Score of 58 out of 100.
The breakdown is more useful than the total, which is the point of publishing it. Two sub-scores are dragging this account: profit factor at 29 and return-over-drawdown at 29. Both are saying the same thing in different units — the edge is real but thin relative to the worst decline — and between them they carry 40% of the composite, so the total is held down by one finding stated twice. Consistency at 94 and sample confidence at 86 are doing the lifting.
Sample confidence at 86 is worth reading carefully, because it is the input that behaves unlike the others. Ninety-six trades is a real history and it scores well — but it is not full marks, and nothing this account does to its trading will move that row. Only more trades will, and only up to 200, where the curve reaches 100 and stops. That is the intended behaviour: the score is allowed to say “this looks good and there is not yet quite enough of it”.
A trader looking at this should not be trying to raise the Tape Score. They should be trying to raise the return-over-drawdown ratio, and the score is simply how they noticed.
Every figure above is from the demo account TapeSheet ships with — 96 closed trades, generated from a fixed seed. Open the same account →
What this does not tell you
The caveat is the part worth reading. Most tools put it in a footer, if they print it at all.
- It is not a prediction and not a verdict on you. It describes a file. A high score means the recorded history has the properties we chose to reward — nothing about what happens next, and nothing about whether you will make money. TapeSheet never claims otherwise, anywhere.
- Sample confidence is not a measure of your trading. It is a measure of how much of your trading we have. It rises with trade count alone, so it can carry a bad account upwards — a losing record with 300 trades collects the full 20 points on that row while its other five sub-scores sit near zero. Read the breakdown, not the total: that is exactly the case the total hides and the breakdown exposes.
- Suppression below 30 trades is a display rule, not a scoring one. The number is computed on every account. Under 30 closed trades the app declines to print it, shows the six sub-scores instead, and says why. If you export a shared report from a short history, the report withholds it too — but the value is still inside the link, because the link carries the metrics rather than the page’s decisions about them.
- Its drawdown input inherits every drawdown caveat. Twenty percent of the score is return divided by maximum drawdown, and that drawdown is balance-based, so it understates the real one. That makes the Tape Score optimistic for anyone who holds through adverse moves.
- The weights encode a view, and it is an arguable one. Profit factor at 20% and win rate at 10% is an opinion about what matters. Someone who believes drawdown dominates everything would weight it at 40% and get a different number from the same trades. Neither is correct; ours is merely written down, which is the only claim this page makes for it.
- It is not comparable to anything. Not to another product’s score, not to another trader’s, and not across accounts with different instruments or holding periods.
Where TapeSheet shows it
The card at the top of the Overview: a gauge, a confidence band reading “low”, “moderate” or “firm” beside it with your trade count, six weighted sub-scores with their caps on hover, and a caveat that changes wording with your sample size. Under 30 closed trades the gauge shows an em dash rather than a number, and the caveat explains that the composite is withheld rather than missing. Every input is also on the dashboard as its own tile, so any part of the score can be checked against the number it came from.
Questions
Why publish the weights when no competitor does?
Because a composite score whose maths is secret cannot be checked, argued with, or corrected — and criticising other products for exactly that while running our own black box would be indefensible. Publishing the weights also means that when a cap is wrong, someone can say so.
Why does my Tape Score show a dash?
Because the file has fewer than 30 closed trades. Nothing is missing and nothing is broken — every other number on the dashboard is computed and correct, and the six sub-scores are still shown. The composite alone is withheld, because under 30 trades a single outlier moves it by several points and printing it would be inventing a precision the data does not have. It appears on its own once the count reaches 30.
Why is the number of trades part of the score?
Because a composite built only from trading statistics will award a near-perfect score to an account with nine trades, and that number is worse than no number — it is confidently wrong. Sample confidence carries 20% of the Tape Score and rises with trade count on a log curve, reaching full marks at 200 closed trades. It is the one part of this composite that no competing product has, and it is the reason ours goes down when the evidence is thin instead of pretending not to notice.
What is a good Tape Score?
There is no answer to that, deliberately. The score is not calibrated against any population of traders, so there is no percentile and no pass mark. Use the six sub-scores to find which part of the record is weakest, and ignore the total once you have.
Related terms
See your own statement, analyzed
Drop an MT4 or MT5 statement on the page and the whole dashboard renders in about three seconds. No signup, no upload — the file is parsed inside your browser tab and never leaves your device.
Analyze my statementAll glossary terms ·Free trading journal ·MT4 statement analyzer ·MT5 report analyzer